Overview and analysis of the 2013 - 2015 portfolio
The total budget for the three year period is 820 000 000 NOK.
The projects were selected based on NICFI thematic and geographic priorities and quality of the proposals. There were also different funding levels for the four categories with the highest amount allocated to the Sustainable landscape category.
Table 1: Categories, number of projects approved in category and budget in NOK and % for 2013-15.
| Category | No of projects | Budget in NOK 2013 - 2015 | Budget in % of total 2013 - 15 |
| Sustainable landscape | 12 | 284 Million | 35 % |
| Commodities | 8 | 194 Million | 24 % |
| Analysis | 14 | 241 Million | 29 % |
| Consensus | 8 | 101 Million | 12 % |
| Sum | 42 | 820 Million | 100 % |
Figure 1: Sum in NOK and % per thematic category 2013-15
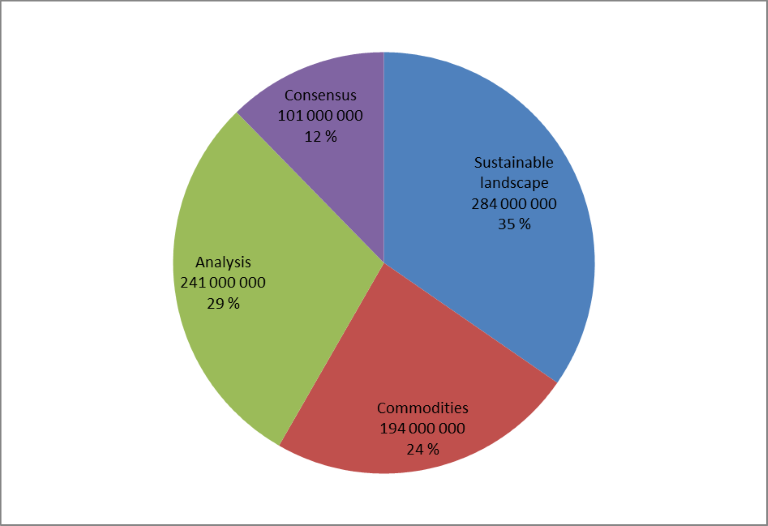
Table 2: Budget sums 2013 per country and global in NOK
| Global | 127 400 000 |
| Brazil | 39 300 000 |
| Indonesia | 32 600 000 |
| Peru | 10 600 000 |
| Mexico | 9 000 000 |
| DRC | 8 000 000 |
| Ethiopia | 5 000 000 |
| Cameroon | 3 300 000 |
| Vietnam | 3 300 000 |
| Liberia | 3 200 000 |
| Ghana | 3 100 000 |
| Colombia | 3 000 000 |
| Myanmar | 2 600 000 |
| Madagascar | 2 400 000 |
| Cambodia | 2 400 000 |
| Tanzania | 2 100 000 |
| Laos | 1 800 000 |
| Asia Regional | 1 800 000 |
| Ecuador | 1 400 000 |
| Guatemala | 1 100 000 |
| Guyana | 1 100 000 |
| Malaysia | 900 000 |
| India | 900 000 |
| Kenya | 800 000 |
| Nepal | 600 000 |
| China | 400 000 |
| Nicaragua | 300 000 |
| Papua New Guinea | 300 000 |
| Costa Rica | 300 000 |
| Philippines | 300 000 |
| Rwanda | 200 000 |
| Zambia | 200 000 |
| South Africa | 100 000 |
| Nigeria | 100 000 |
| Sum | 269 900 000 |
Figure 2: Budget sums 2013 per country and global in NOK
The pie chart shows the 2013 budget per country, global and regional with a total of 270 Million NOK. Detailed amounts can be found in the table. Some of the budget in the large ‘Global group’ are costs that should have been allocated to a country. In budgets for 2014 and 2015 Norad will get more detailed country budgets for the 42 projects and will be able to allocate more of the budgets to the relevant country.

Figure 3: Budget 2013, split between countries in Million NOK

The pie chart shows the 2013 budget per country, total 142,5 million. The Global projects and global activities are not included (127,5 mill NOK). Countries with project activities of less than
1 million NOK are gathered in the group ‘Other countries’. Detailed amounts can be found in the table.
The ‘global group’ is removed from this pie chart to get a better overview of the split between countries.
Table 3: 2013 budget and number of project approved per category per country
| Country | Budget 2013 | No of Projects | Sustainable landscape | Commodities | Analysis | Consensus |
| Brazil | 39 300 000 | 22 | 5 | 4 | 8 | 5 |
| Indonesia | 32 600 000 |
30 |
6 | 7 | 11 | 6 |
| Peru | 10 600 000 | 12 | 4 | 1 | 4 | 3 |
| Mexico | 9 000 000 | 10 | 3 | 1 | 3 | 3 |
| DRC | 8 000 000 | 12 | 2 | 0 | 8 | 2 |
| Ethiopia | 5 000 000 | 1 | 1 | 0 | 0 | 0 |
| Cameroon | 3 300 000 | 6 | 2 | 0 | 3 | 1 |
| Viet Nam | 3 300 000 | 9 | 3 | 1 | 5 | 0 |
| Ghana | 3 100 000 | 3 | 1 | 1 | 0 | 1 |
| Colombia | 3 000 000 | 6 | 3 | 2 | 1 | 0 |
| Myanmar | 2 600 000 | 5 | 1 | 1 | 2 | 1 |
The table shows that Brazil has the highest budget amount, while Indonesia has the highest number of projects. The commodity projects are to a large degree global (focusing on demand side), but at the country level (supply side) they are concentrated on Brazil and Indonesia. DRC and the Congo basin are not targeted by the projects in the commodity category.
The table includes the countries with the highest budgets and/or a high number of projects.
To learn more about the portfolio, study the world map and select the relevant country, thematic category and focus areas and project type you are interested in to get a list of the projects that match your search criteria.